You can compare grid electricity with your Tesla Powerwall’s remaining energy, and see price context, without repeatedly opening an app. A glanceable display can show live power flow among solar, the home, the grid, and the Powerwall, plus remaining battery capacity and estimated cost at the current rate. Everview’s Tesla Powerwall real-time data monitor is an e-paper screen designed for that comparison.
If you want a dedicated screen for this view, see the Everview Tesla Powerwall home energy monitor.
What should you see together on one screen?
For a Powerwall household, the useful picture is usually not a single number. You want to know whether the house is running on solar, stored battery energy, or the public grid—and how much reserve is still available. You also want a simple cost readout, because kilowatt-hours are easier to understand when they appear next to a rate and an estimated cost.
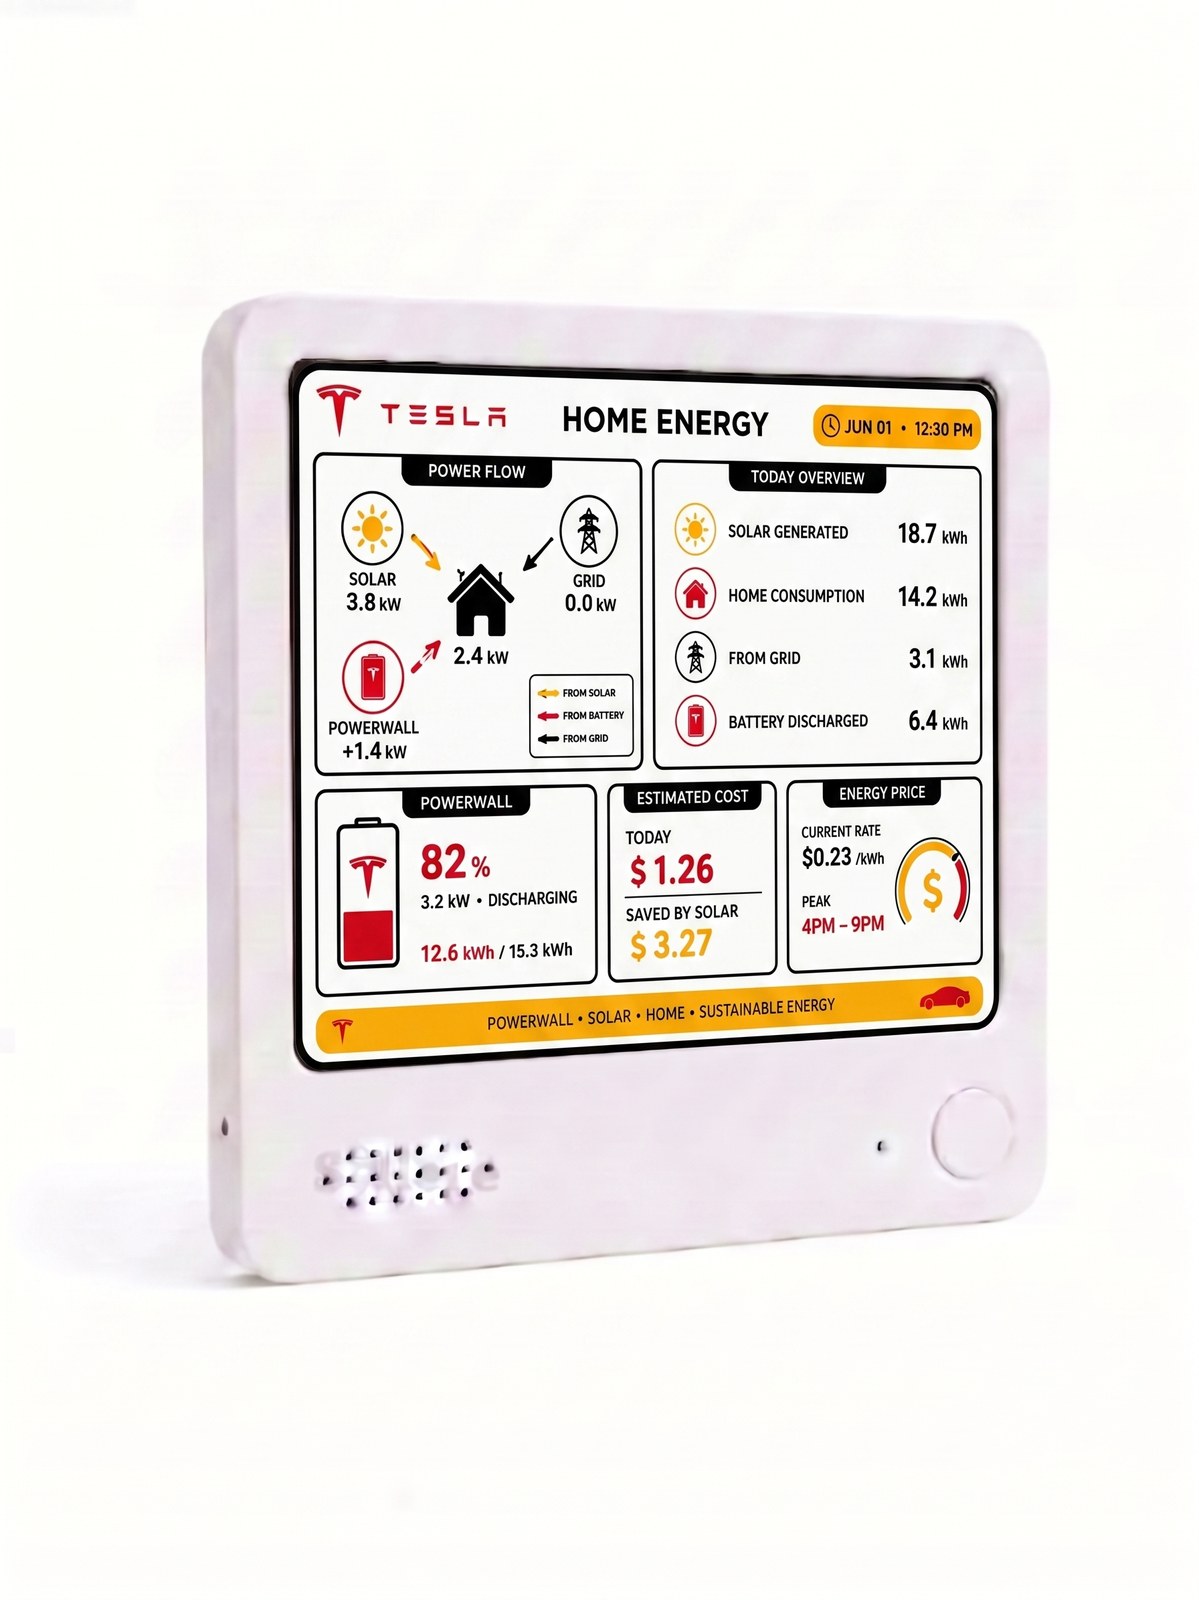
Everview describes this as understanding the flow between solar, home, grid, and battery at a single glance. The product listing’s own photos show a Tesla home energy dashboard that places several comparisons side by side:
- Live power flow among solar, the home, the grid, and the Powerwall
- Today’s energy totals, including solar generated, home consumption, energy taken from the grid, and energy discharged from the battery
- Powerwall reserve as a percentage and as remaining energy versus total capacity
- Estimated cost for the day, savings attributed to solar, the current electricity rate, and a peak-price window
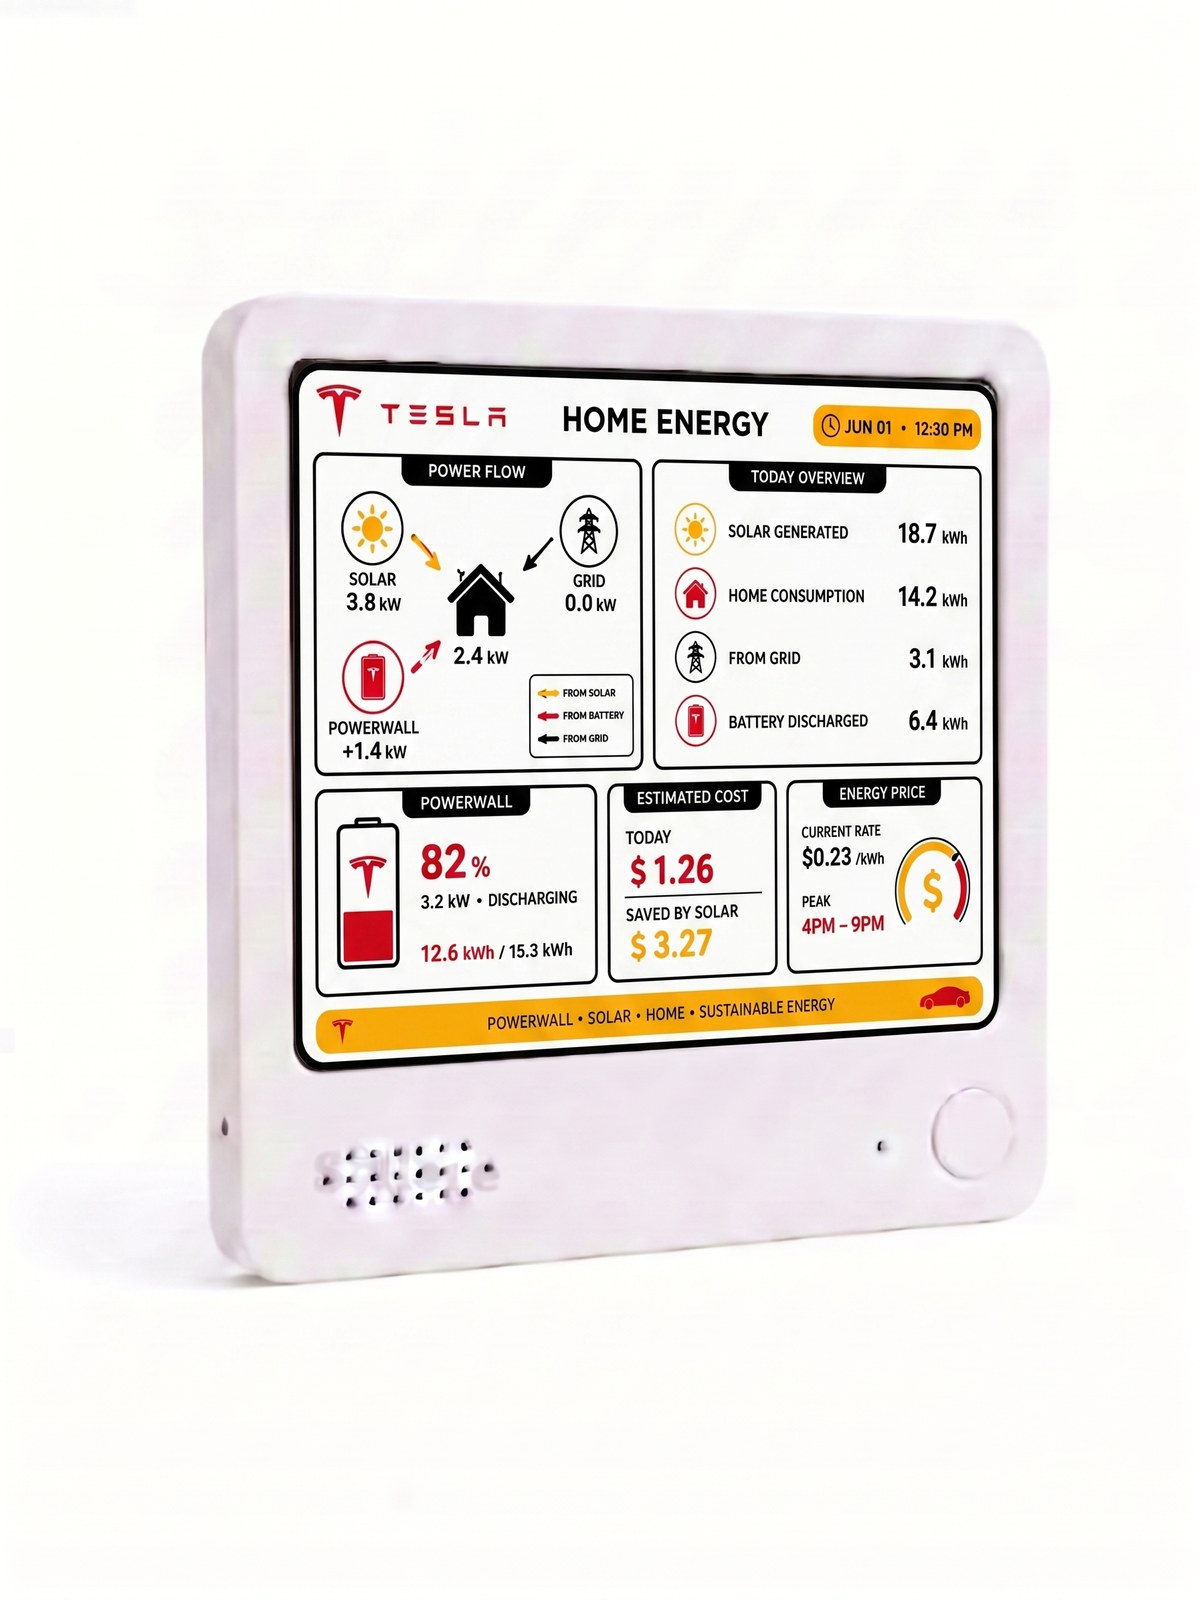
This product-listing photo shows how grid power, Powerwall reserve, estimated cost, and the current energy rate can appear together. The numbers on the screen are examples of the layout, not typical household results or a promise of savings.
How is this different from only opening the Tesla app?
The Tesla app is the place to manage your system. A desk display answers a different question: what is happening right now, when you simply look up? Everview positions the display as read-only. It shows the signals you choose without taking control of the connected source.
That difference shows up in daily use. Checking energy flow on a phone usually means unlocking the device, opening an app, and moving through more than one screen. An e-paper display can stay on a kitchen counter, fridge, or desk and keep the same comparison visible. The current product page describes a 4-by-4-inch (10 cm) paper-like screen, a built-in battery that can last up to a week on a charge, USB recharging, a magnetic back, and a stand.
What does Everview add beyond displaying raw Powerwall data?
Connecting to Tesla so the display can receive Powerwall data is only the first step. The useful part of this view is the calculation and layout that let you compare sources at once.
Instead of seeing battery status in one place and grid import in another, the dashboard is arranged so you can compare public-grid energy with the Powerwall’s remaining energy on the same screen. Daily totals turn live kilowatts into kilowatt-hours, which makes it clearer whether the house leaned on the grid or on stored energy. Cost context sits next to those totals: an estimated amount for the day, an amount saved by solar, the current rate per kilowatt-hour, and when peak pricing applies.
This does not replace your utility bill or Tesla’s own reports. It is meant to make the relationship among grid use, battery reserve, and price readable in a few seconds.
How do you get Powerwall, grid, and price data onto one screen?
The public listing does not publish a click-by-click Tesla login sequence. Based on Everview’s documented setup flow, the practical steps look like this:
- Link a Home Energy source to the Everview account that owns your display.
- Choose a view that shows solar, home, grid, and battery together, so remaining Powerwall energy and grid use appear in one place.
- Place the display where you will actually see it—on a desk with the included stand, or on a metal surface with the magnetic back.
- After purchase, watch for Everview’s follow-up email about specific settings. If a dashboard gets stuck, the company says its engineers can help remotely.
The display also needs cloud sync to keep data updated: $5 per month after a free first month, covering secure data transfer, remote configuration, and over-the-air support.
What should you check before choosing a home energy display?
Before you buy any glanceable monitor, match the screen to the decisions you actually make:
- Confirm that it connects to Tesla home energy data for your Powerwall, rather than only showing a generic battery icon.
- Look for grid use and Powerwall remaining energy in one view, not as separate apps you still have to open.
- Check whether price context is included if cost is part of how you decide when to use stored energy.
- Decide between a color e-ink screen and a black-and-white screen. The listing notes that the color version needs a brief flash and a few seconds when switching views; the monochrome version is described as having no flash and faster switching.
- Note the current product-page details: $69 for the black-and-white screen or $109 for the color screen, plus a fixed $15 shipping fee.
What should you keep in mind?
A display like this is for seeing information, not for controlling the Powerwall. Treat the numbers as a convenient snapshot of your connected Tesla energy data, and use the Tesla app or your utility account when you need official history, settings, or billing.
Color e-ink is designed for clarity, not instant animation. If you expect to switch views often and want no refresh flash, the monochrome option is the one the product page recommends.
If a glanceable comparison of grid energy, Powerwall reserve, and prices would help you understand your home at a look, you can review the Everview Tesla Powerwall real-time data monitor.