You can keep Polymarket whale activity visible without repeatedly opening the site or a whale-tracker tab. An e-paper desk display can place a selected market’s probability alongside estimated whale flow, net flow, and recent large trades on one always-on screen. Everview’s Polymarket Whale Radar is an e-paper desk dashboard that also offers Smart Money vs Crowd and Smart Money Leaderboard layouts. It is an independent display, not an official Polymarket product.
If you want a dedicated desk display for this view, see the Everview Polymarket Whale Radar E-Ink Display.
What can a Polymarket e-paper desk display show besides market probability?
Polymarket already shows a market price. Its official help pages explain that those prices are treated as the current probability of an event, set by what other users are willing to buy and sell. A glanceable desk display is meant to add another layer: a short picture of estimated whale activity and money flow that you can read when you look up.
The official copy on this Everview listing describes a Whale Radar view that surfaces:
- Market probability for a selected Polymarket market
- Whale flow, or estimated whale buying activity on YES versus NO over a selected time window
- Net whale flow, showing which side is receiving stronger net whale activity
- Whale activity, including detected whale trades and recent large transactions
- Whale money direction, or whether tracked activity is leaning toward YES or NO
- Major trade alerts, so you can notice significant activity without keeping Polymarket open all day
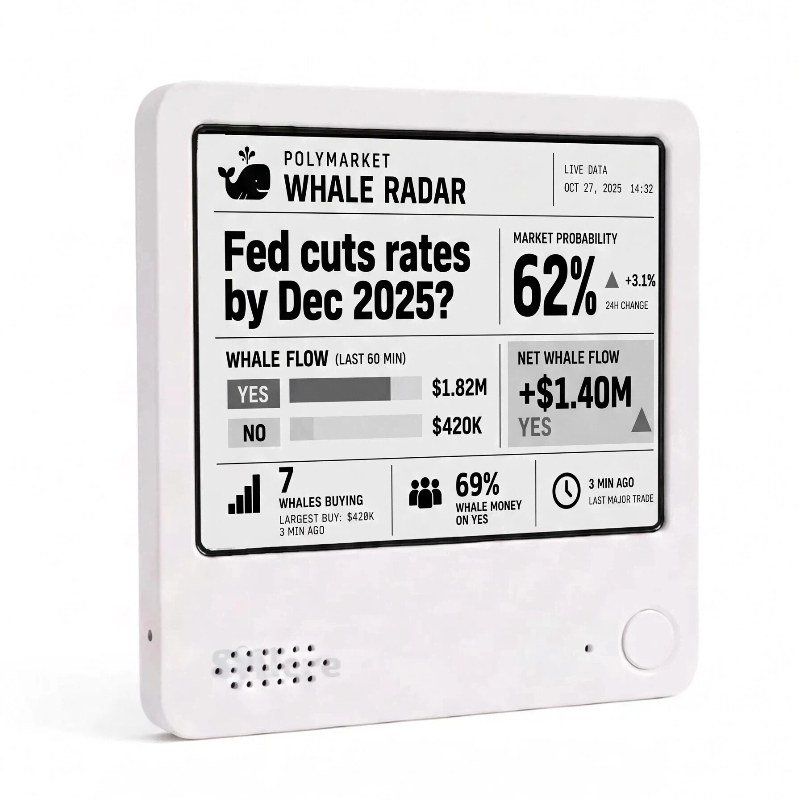
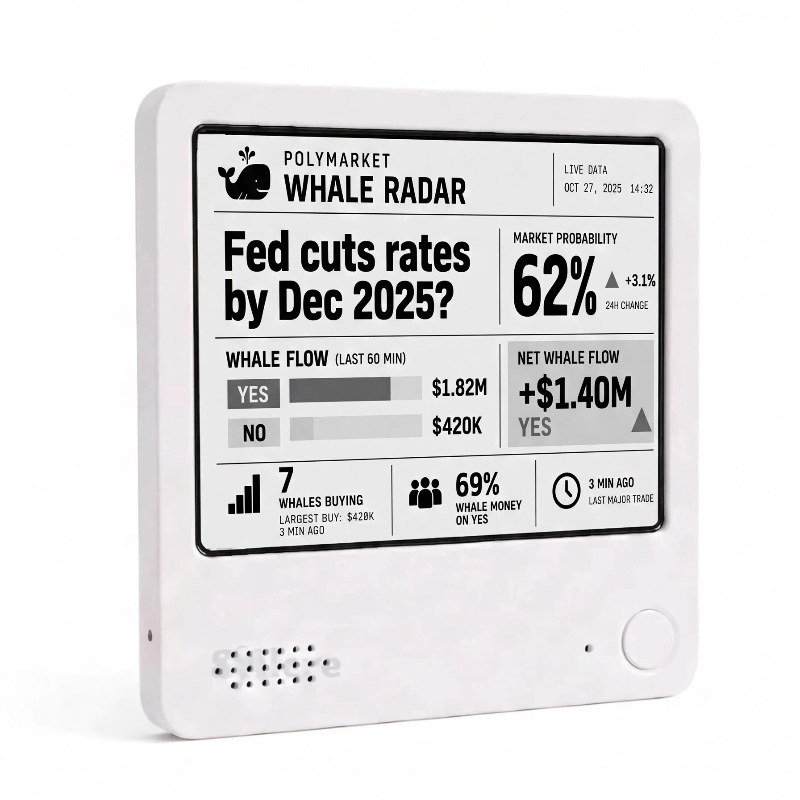
This product-listing photo shows the Whale Radar layout on a black-and-white e-paper screen. The sample market is “Fed cuts rates by Dec 2025?” with figures such as a 62% market probability, whale flow of $1.82M on YES and $420K on NO, and net whale flow of +$1.40M toward YES. Those numbers illustrate the design. They are not typical results, and they are not a forecast.
How is a desk display different from checking Polymarket or a whale-tracker site?
Polymarket remains the place to open a market, review the official odds, and trade. The same help pages note that you trade with other users rather than against a house. Most “Polymarket whale tracker” tools are websites, wallet leaderboards, or alert feeds that you check on a phone or computer.
A desk display answers a narrower question: when you look up, can you see the selected market’s probability and a short estimate of whale flow without unlocking a phone or refreshing a tab? The listing describes an always-on e-paper screen with excellent daylight visibility, no bright LCD on the desk, extremely low power consumption, and a minimalist trading-desk aesthetic.
The listing does not publish a refresh interval. Official photos include a “LIVE DATA” timestamp and the product title uses “Live,” but this article does not describe second-by-second updates. Treat the screen as an always-visible snapshot of the data Everview’s service prepares.
Which layout should you choose: Whale Radar, Smart Money vs Crowd, or the Leaderboard?
Checkout on this listing offers three display styles, all at the same price, and all labeled “B&W Screen”:
- Whale Radar is the layout described in the written product copy, focused on one selected market’s probability and estimated whale flow.
- Smart Money vs Crowd is shown in official photos as a side-by-side comparison for one sample market.
- Smart Money Leaderboard is shown in official photos as a “Smart Money Today” list of several sample markets.
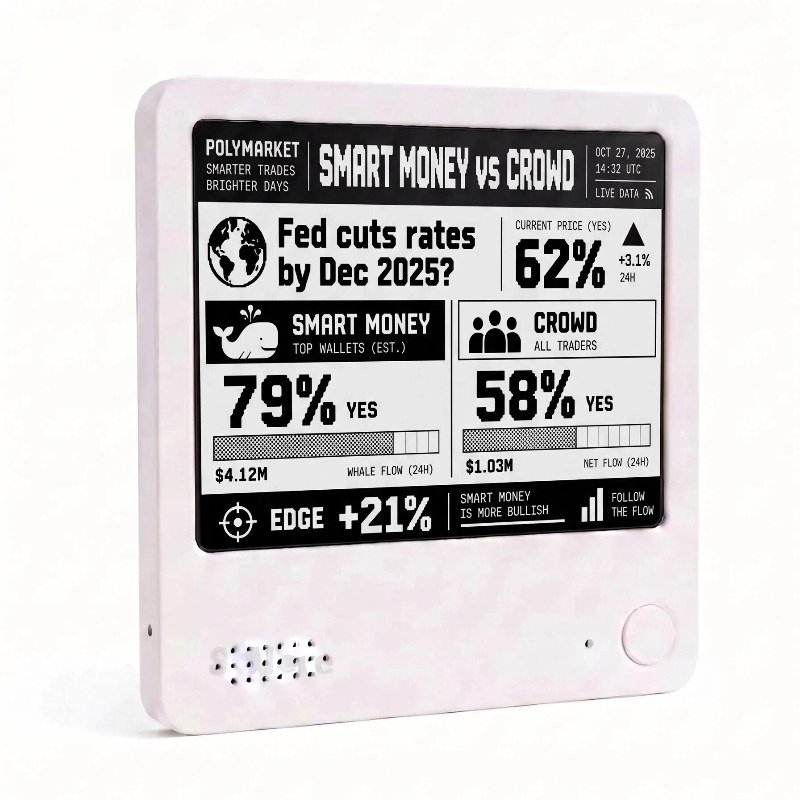
The Smart Money vs Crowd product photo compares an estimated “Smart Money / Top Wallets” YES figure of 79% with a “Crowd / All Traders” YES figure of 58%, plus 24-hour flow totals and an “Edge +21%” line that reads “Smart money is more bullish.” The written listing does not define how those percentages are calculated, so treat the photo as an example of the layout, not as a documented formula.
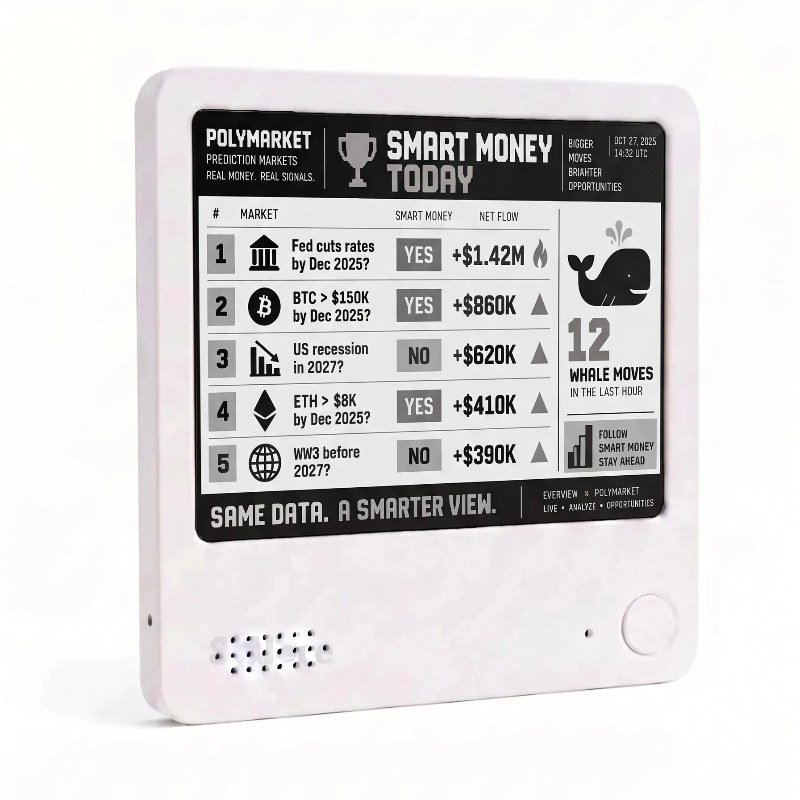
The leaderboard product photo lists five sample markets, each with a YES or NO side and a net flow figure, plus a count of “12 whale moves in the last hour.” The written listing does not describe this table in prose; the official photo is the evidence for how that style can look. The sample questions and dollar figures are examples of the layout only.
Choose Whale Radar for one market’s whale flow, Smart Money vs Crowd for a sentiment comparison, or the leaderboard for several markets in one list. The listing says you can choose the markets you want to follow.
How do you get Polymarket data onto an e-ink desk display?
The public listing does not publish a click-by-click login sequence, and it does not ask you to create API keys or connect a trading wallet. It says Whale Radar connects to Everview’s data service, which processes Polymarket market information and prepares it for the display. You choose the markets you want to follow and keep the most important activity visible throughout the day.
Checkout on this page is $69.00 USD for each of the three black-and-white display styles, plus a fixed $15 USD worldwide shipping fee. The listing does not publish a subscription price, device size, battery life, or unboxing steps, so those details are omitted here.
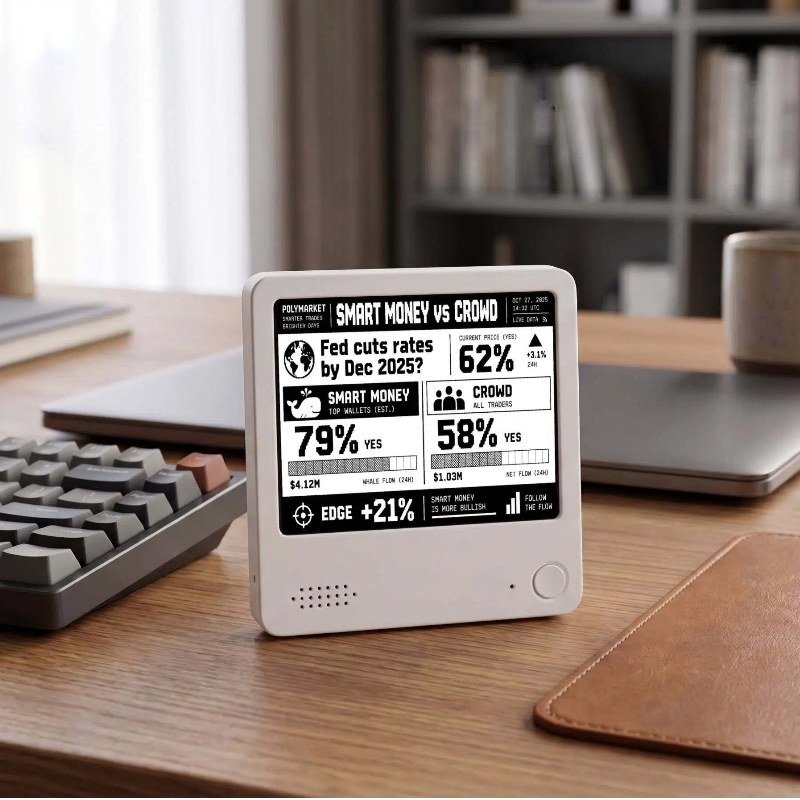
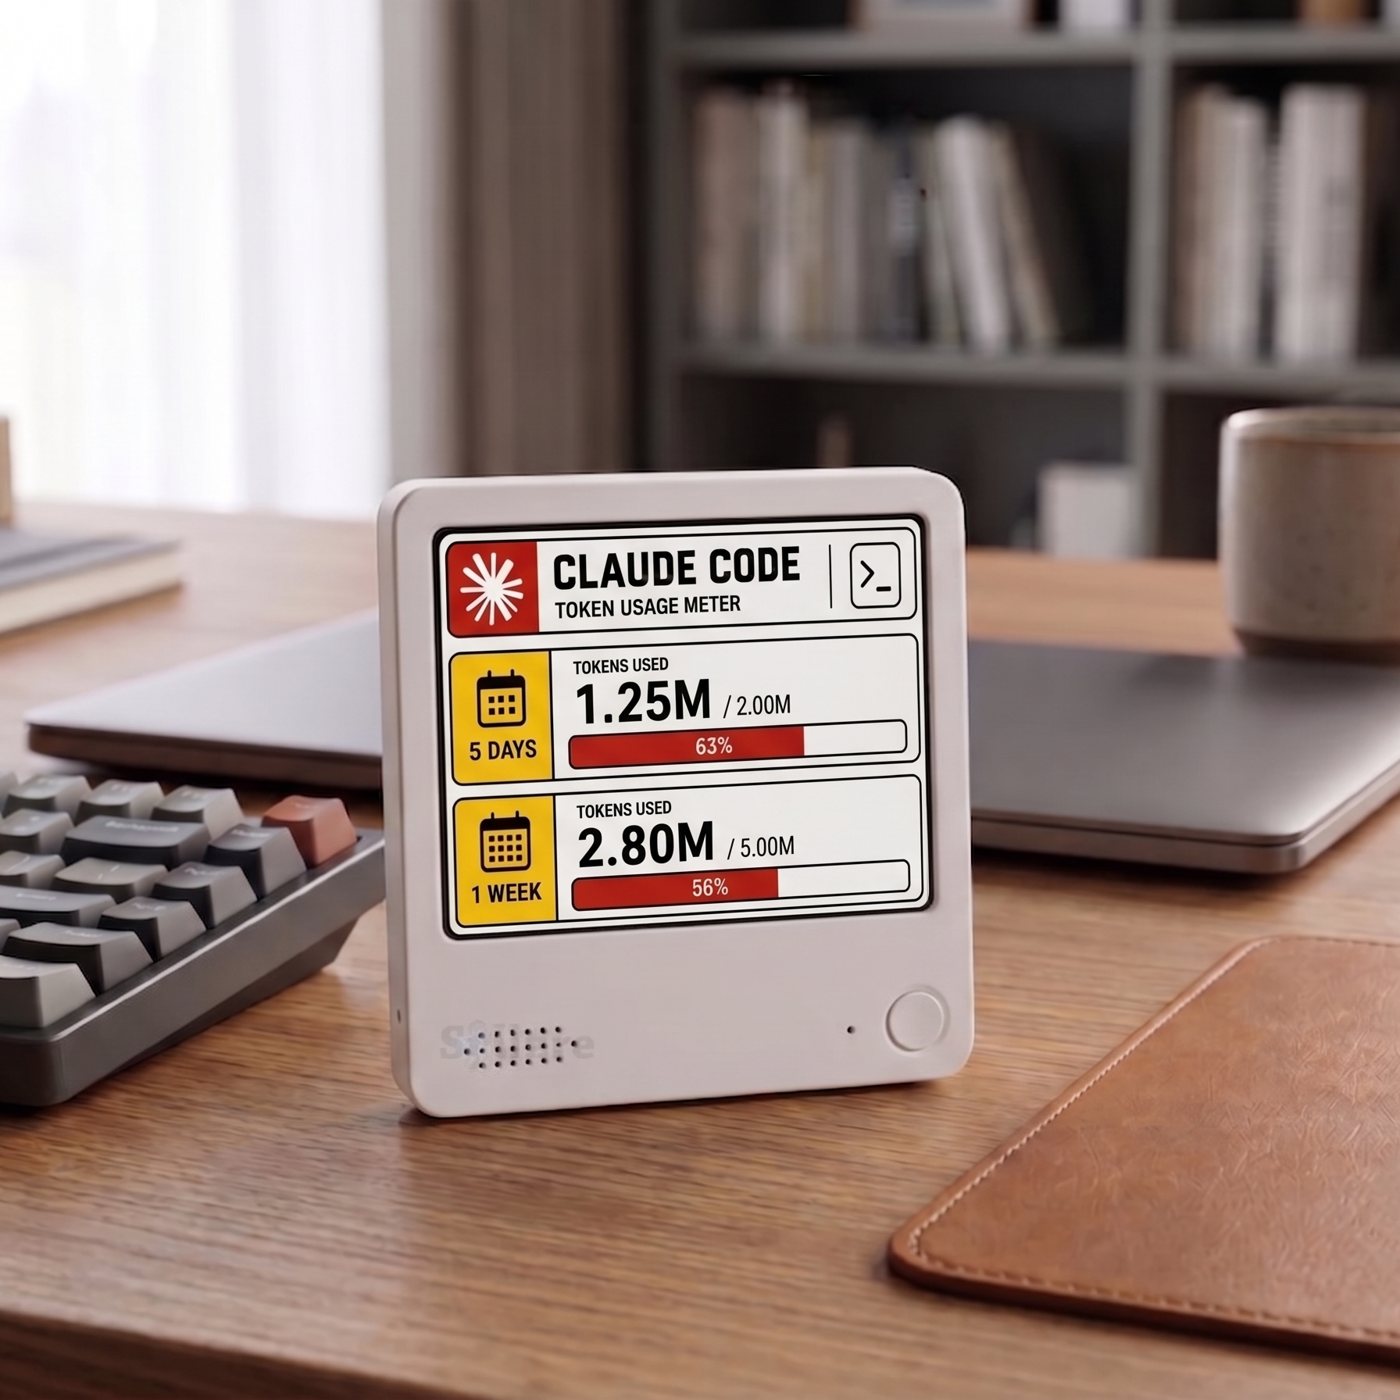
This official photo shows the display standing on a wooden desk. Other photos show it held in two hands or placed on a refrigerator. The listing does not describe a magnetic back or an included stand, so confirm placement accessories if they matter to you.
What should you check before buying a Polymarket desk display?
Before you buy, match the screen to the decisions you actually make:
- Confirm that you want more than the probability already visible on Polymarket. This listing is built around estimated whale activity and money flow, not a simple price ticker.
- Keep Polymarket itself for trading and for the official market page. This display is a desk view, not a trading terminal, and the listing states that it is not affiliated with, endorsed by, or sponsored by Polymarket.
- Read the estimates disclaimer. Whale classifications, whale-flow metrics, and other derived indicators are analytical estimates from available market data. They should not be read as guaranteed identification of individual traders, as predictions, or as investment recommendations.
- Note the screen wording. The written description mentions a 4-color e-paper screen that uses black, white, red, and yellow. Checkout options are all labeled “B&W Screen,” and the official layout photos appear in black, white, and gray. If color accents matter to you, confirm the screen option before you buy.
- Note the current price: $69.00 USD, plus a fixed $15 USD shipping fee for worldwide delivery. No subscription price or update interval is published.
What should you keep in mind?
A display like this is for seeing a short snapshot of processed Polymarket data, not for placing trades or relying on whale flow as a reason to buy or sell. The listing is clear that prediction markets involve risk, and that all information shown is provided for informational purposes only. The sample figures in the product photos, including the 62% probability and the dollar flows, are examples of the layout, not typical results.
If you want Polymarket whale activity visible on the desk, the Everview Polymarket Whale Radar E-Ink Display is the listing that matches this view.